My First Infographic was Made with Piktochart
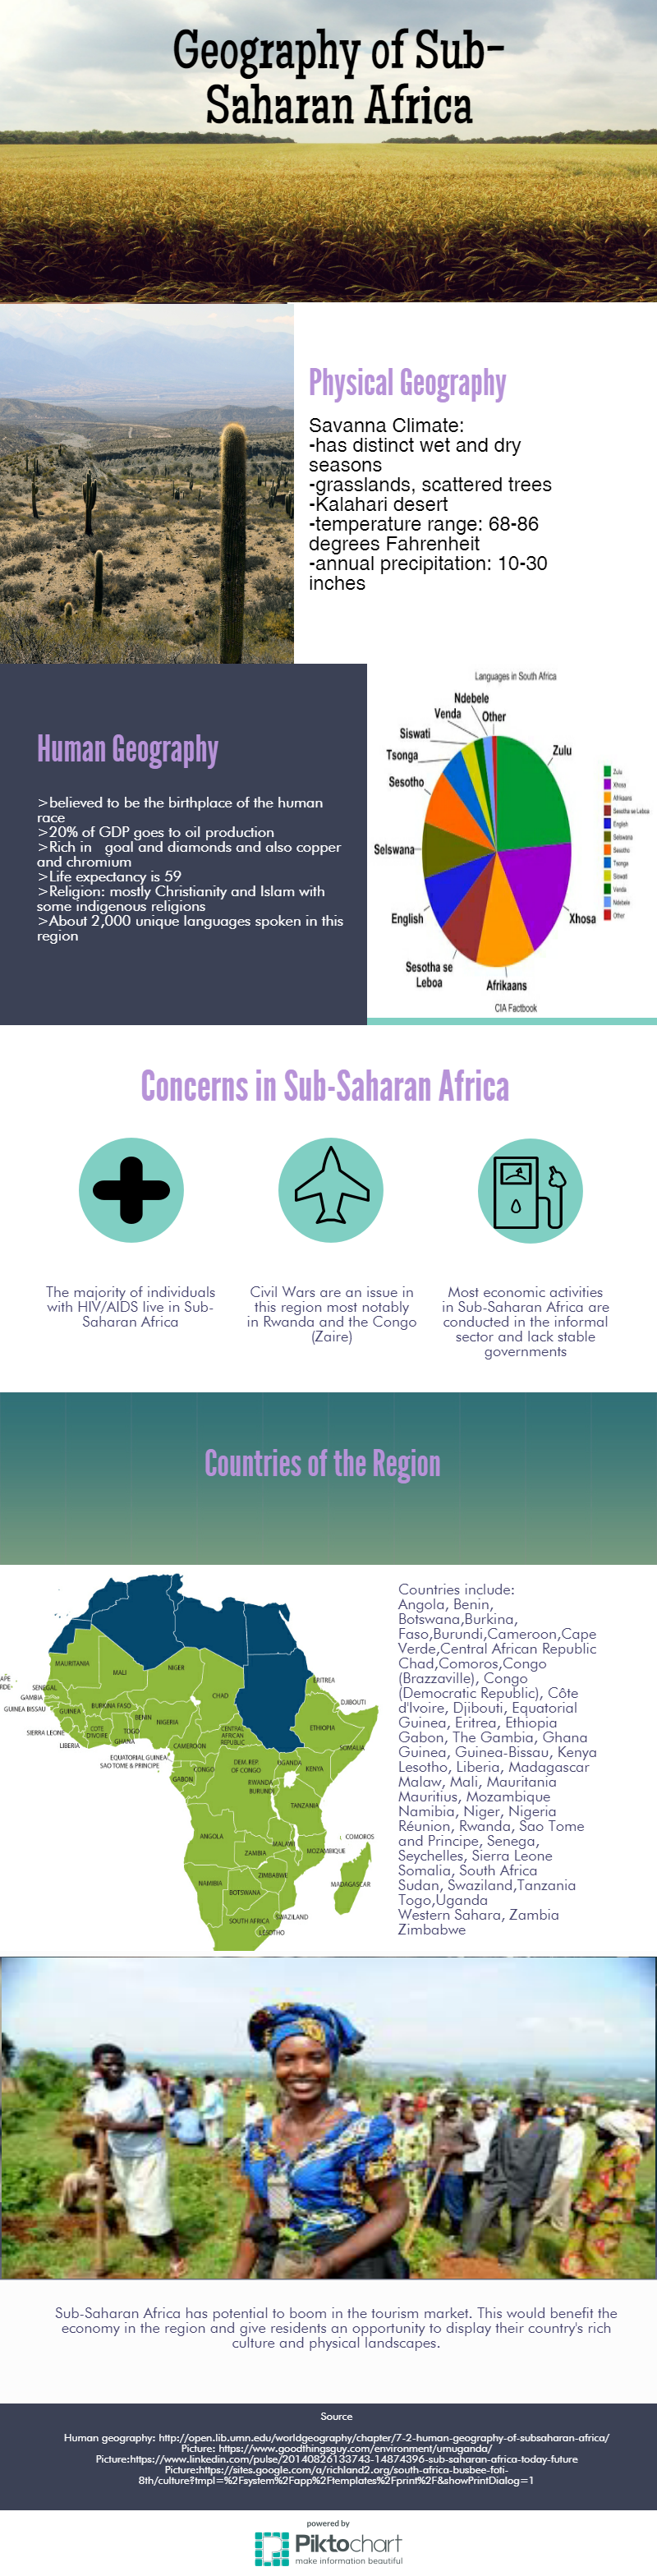
I made an infographic on the geography of Sub-Saharan Africa. To do this I used an app called Piktochart which is a free app https://appsto.re/us/-f7f3.i. The description of this app is that it is an iPad app that comes along with the essential functions to create, download, and publish your visuals. It features: select your own templates and create inforgraphics, posters, presentations, and reports, Edit your existing visuals, Save your visuals to your account, Download and publish your visuals, share it through email or to your favorite social media platforms, Present your published presentations with our built in presentation mode, Visit featured infographic gallery so you never run out of ideas, Use customizable elements including text, shapes, icons, and photos. Over 5 million users across the world love Piktochart- including small business owners, content marketers, educators, non-profit organizations, bloggers, and more.
I think this app would be very helpful in my future Secondary Social Studies classroom. Infographics could be used to show timelines of different wars or periods of history and also to document the histories of certain events and people. I could use Piktochart to make posters for my classroom, infographics for certain units, and as a assignment for students to make their own infographics. Some limitations I found was that I did not think it was ideal for iPad usage, but I found it easy to use on my computer. The difficulties I found were when using a template I thought it was hard to insert my own text. Either the text from the template would not erase or I could not see what I was typing in the text box. The strengths of this app are there are many templates to choose from so if you start on one and do not like how your project is turning out you can always try another one. I also like the options to include icons or pictures because it breaks up the monotony in a project and allows the user to create a unique project.
Overall, I think this is a great app for teachers. It is easy to use once you get the hang of it, but I would suggest using a laptop or computer over an iPad. It is neat because you can customize your very own infographic or poster for classroom use or assign students to make their own as a project for class.
Be sure to check out my inforgraphic pinterest board!
To get started, I watched this YouTube video about Piktochart for beginners.
